
Top Exporters of Coffee Globally In 2025
Introduction
Talking about global coffee export market, yTrade reveals that Vietnam, Brazil, and Colombia take the lead in the exporting countries.
However, there is a major shift, where it raises a bigger question for anyone watching the industry: what exactly allowed certain countries to pull ahead while others struggled with climate shocks and supply issues? This breakdown of the top exporters of coffee gives you the full picture.
Top exporters of coffee globally in 2025
Who is the largest exporter of coffee?
According to yTrade’s 2025 shipment data, the largest exporter of coffee is the Federación Nacional de Cafeteros de Colombia, leading the global market with 11,662 shipments, US$1.84B in export value, and over 480 million kg of coffee exported. This makes Colombia the dominant player in global coffee exports, significantly ahead of other suppliers in both volume and value.
Who is the top 5 coffee producer in the world?
- Federación Nacional de Cafeteros de Colombia – The world’s No.1 exporter with US$1.84B in coffee exports and the highest shipment volume globally.
- Sucafina Colombia S.A.S – A major Colombian exporter delivering nearly US$900M in coffee shipments across key global markets.
- Nestlé Nespresso SA – A leading supplier of premium processed coffee products with strong global distribution.
- Starbucks Corporation – Exports high-value roasted and processed coffee, leveraging a global sourcing and roasting network.
- Nestlé Vietnam Limited – A top exporter representing Vietnam’s strong Robusta and blended coffee supply with over US$500M in annual export value.
| Rank | Supplier | Top Traded HS Codes | Shipments | Export Value (US$) | Weight (kg) | Quantity |
|---|---|---|---|---|---|---|
| 1 | Federación Nacional de Cafeteros de Colombia | 090111 210111 090121 | 11,662 | 1,846,461,611.49 | 480,392,339.83 | 306,540,525.95 |
| 2 | Sucafina Colombia S.A.S | 090111 090112 999900 | 8,213 | 888,454,465.45 | 252,816,881.40 | 156,139,883.59 |
| 3 | Starbucks Corporation | 210690 090121 392410 | 8,096 | 91,265,862.12 | 16,172,923.68 | 4,007,013.52 |
| 4 | Nestlé Vietnam Limited | 090121 210111 210112 | 8,055 | 506,481,650.51 | 484,896.35 | 19,553,427.48 |
| 5 | Nestlé Nespresso SA (Export Entry 1) | 090121 851671 691110 | 9,043 | 93,921,416.37 | 19,580,095.71 | 64,194,325.87 |
| 6 | Nestlé Nespresso SA (Export Entry 2) | 090121 090122 851671 | 7,753 | 106,513,693.12 | 55,297,030.58 | 11,187,080.47 |
| 7 | PT. Birotika Semesta | 621112 620419 620443 | 7,734 | 272,572.24 | 20,859.54 | 7,913 |
| 8 | Spar Western Cape PTY LTD | 220421 220600 220820 | 16,723 | 2,897,544.56 | 1,003,489.91 | 80,386 |
Top Exporters of Coffee Globally in 2025 (By Value)Data Source: yTrade
When finiding potential buyers, most exporters aren’t held back by product quality — they’re held back by unclear buyer demand.
Too often, teams spend months emailing prospects who don’t import the product anymore, enter markets that look promising on paper but have low real demand, or lose deals simply because a competitor reached the right buyer first. What exporters need is not more leads, but clarity.
yTrade’s Buyer Discovery & Sales Targeting solves this by giving you:
- A list of active importers filtered by HS code, product type, country, or port
- Insight into real shipment volumes so you know who buys consistently
- Visibility into who they currently source from (and where the gaps are)
- Early signals of rising demand in markets your competitors haven’t noticed
Request a yTrade demo and start targeting buyers with real, verified demand.

An overview to global coffee export market in 2025
1. A year of high activity and resilient demand
According to yTrade, the global coffee export market in 2025 experienced intense trading activity through most of the year, with buyer and supplier participation peaking between March and August. During this period:
- Monthly buyers ranged from 3,938 to 4,403, while suppliers stayed around 3,169 to 3,290.
- Shipments were consistently high, hitting 32,937 in March and 31,672 in April.
- Export values peaked at over US$4.28 billion in April and remained above US$3.5 billion across May to July.
| Month (2025) | No. of Buyers | No. of Suppliers | Shipments | Export Value (US$) | % of Total Export Value |
|---|---|---|---|---|---|
| Oct | 1,372 | 1,292 | 6,408 | $811,147,706.71 | 0.17% |
| Sep | 3,114 | 2,361 | 18,395 | $1,786,190,526.62 | 0.38% |
| Aug | 3,925 | 3,068 | 25,378 | $5,903,112,837.57 | 1.24% |
| Jul | 4,324 | 3,290 | 28,083 | $2,996,850,368.20 | 0.63% |
| Jun | 3,938 | 3,169 | 27,287 | $3,020,126,236.79 | 0.63% |
| May | 4,369 | 3,179 | 29,757 | $3,575,311,806.19 | 0.75% |
| Apr | 4,161 | 3,045 | 28,750 | $3,532,938,283.18 | 0.74% |
| Mar | 4,403 | 3,279 | 31,672 | $4,282,391,807.93 | 0.90% |
| Feb | 4,000 | 3,084 | 27,557 | $3,468,805,763.78 | 0.73% |
| Jan | 3,695 | 2,854 | 25,755 | $2,582,714,509.96 | 0.54% |
Coffee Trade Trends by Month — 2025 (yTrade Data)Data Source: yTrade
This steady momentum signals strong importer confidence and demand, despite global price hikes. Consumption in North America and Europe remained stable, while demand in emerging markets in the Middle East and Asia-Pacific grew faster.
November was an outlier with a steep drop to only 190 buyers and 300 suppliers, likely due to year-end bottlenecks and strategic stocking earlier in the year, highlighted by yTrade. However, this dip doesn't reflect a weakening market, the overall structure stayed solid through 10 of 12 months.
2. Vietnam emerges as the market’s growth engine
How big is the global coffee industry in 2025?
According to yTrade’s export data, the global coffee industry in 2025 reached a staggering US$475.3 billion in export value. The total export volume hit 20.66 billion kilograms, reflecting the immense scale of global coffee trade.
In particular, Vietnam solidified its position as the top-performing origin in 2025. Driven by record-high Robusta prices and export demand, Vietnam is projected to cross US$8 billion in export value by year-end, a historic high for the country.
Key trade indicators reinforce its dominance:
- 159,324 shipments in 2025 — the highest of any country, accounting for 15.16% of global volume.
- Export weight exceeded 1.25B kg, placing it among the heaviest-volume suppliers.
- Quantity surpassed 1.21B units, equivalent to 12.61% of total export quantity.
Vietnam also achieved an average export price of over US$5,600 per tonne in H1 2025, supported by:
- El Niño-driven shortages in Brazil and Indonesia.
- Robust global demand, especially in low-cost instant and RTD segments.
- Early year purchasing spikes due to fears of tightening global supply.
| Country | No. of Suppliers | Shipments | Export Value (US$) | Export Weight (kg) | Quantity Exported |
|---|---|---|---|---|---|
| Vietnam | 1,989 | 159,324 | $8.04B | 1.25B kg | 1.21B units |
| Colombia | 2,791 | 133,967 | $10.78B | 3.73B kg | 1.86B units |
| Brazil | 2,556 | 85,899 | $10.55B | 3.99B kg | 625.57M units |
| India | 1,478 | 67,285 | $4.87B | 857.84M kg | 572.56M units |
| Indonesia | 1,334 | 56,236 | $6.07B | 1.28B kg | 1.21B units |
| Peru | 999 | 49,508 | $5.39B | 1.39B kg | 852.85M units |
| S. Africa | 1,494 | 43,952 | $50.28M | 10.79M kg | 3.68M units |
| Mexico | 1,570 | 42,330 | $5.70B | 968.52M kg | 4.84M units |
| Italy | 1,745 | 40,243 | $532.29M | 177.77M kg | 65.35M units |
| Ethiopia | 2,182 | 30,455 | $5.70B | 968.52M kg | 4.83M units |
Top Coffee Exporting Countries in 2025Data Source: yTrade
However, Vietnam’s smallholder-based model may face growing regulatory pressure from the EU’s new deforestation-free rules, requiring full traceability for all coffee exports.
You can also explore how Vietnam performs in other high-value export sectors.
For example, our Vietnam Aircraft HS8802 Export Data 2025 October Overview shows a sharply concentrated market where Vietnam itself accounts for over 90% of total export value, with Cambodia as the only notable external buyer.
The analysis reveals how Vietnam’s aircraft exports, based on processed Customs data from yTrade, are heavily shaped by domestic retention, regional reliance, and clear supply chain risks. Read now!
3. Supply pressures and regulatory challenges ahead
While the market showed growth, it wasn’t without strain. Supply chain disruptions, shifting policies, and climate volatility made 2025 a challenging environment for both producers and buyers.
Key headwinds included:
- Geopolitical instability, port congestion, and high freight rates that inflated shipping costs.
- Climate shocks like El Niño damaged harvests in Brazil and Indonesia, reducing availability of Arabica beans.
- Tariffs on Brazilian coffee shifted buyer preference toward Vietnam, Colombia, and Peru.
From a compliance perspective, the EU Deforestation Regulation (EUDR) is set to reshape sourcing and supply chains. Its requirement for full traceability (post-2020 deforestation cut-off) poses a serious barrier for countries like Vietnam, where millions of smallholders are not yet equipped with digital tracking.
- This could lead to supply consolidation, leaving smallholders behind.
- Buyers may reduce risk by narrowing sourcing to compliant suppliers or countries.
The outlook for 2026 remains cautiously optimistic, but ongoing investment in logistics, traceability, and climate adaptation will be critical for sustainable export growth.
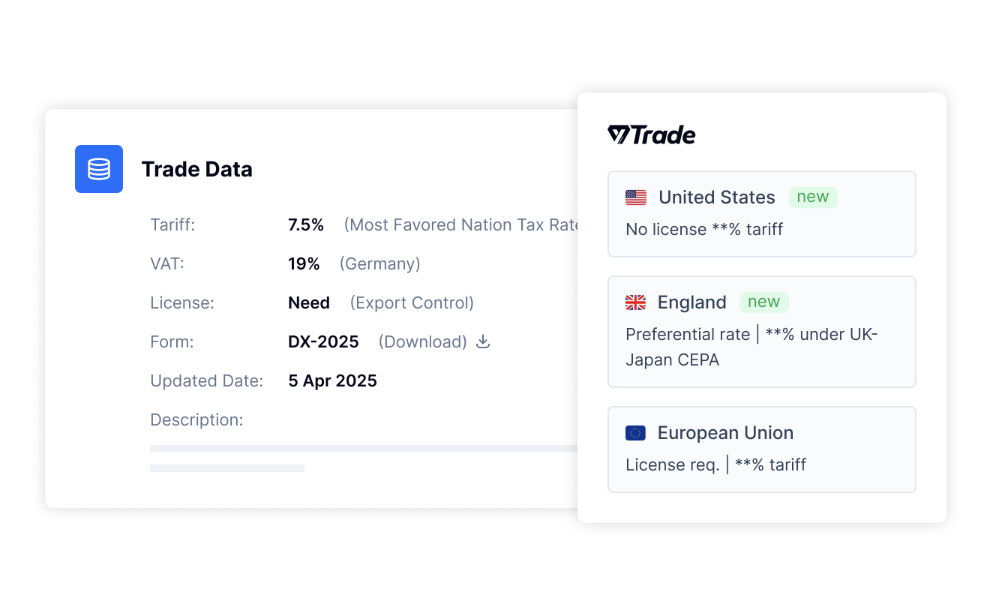
Different countries have their own different regulatory languages and exporters feel that every time they try to compare tariffs, VAT rates, or license rules across markets. One destination needs a permit, another doesn’t. One applies a preferential rate, another adds a surcharge.
The thing is: It’s not confusing because it’s complicated — it’s confusing because nothing is consistent.
yTrade’s Trade Restrictions & Licensing feature fixes that by putting every market’s rules into one unified view.
You can compare tariffs, taxes, licenses, and controls side-by-side, see which markets are easier to enter, and plan pricing or routing with confidence, all in one single system, without switching between government sites.
If you want clarity instead of contradictions, request a yTrade demo.
Global export coffee market forecast in 2026
The global coffee export market in 2026 is expected to remain strong, with export volumes projected to reach approximately 122 million 60kg bags during the 2025/26 crop year. This bullish outlook is largely driven by production recoveries in key regions like Vietnam and Indonesia, and record-high output in Ethiopia, according to industry forecasts and USDA projections.
As global production rises to a projected 178.7 million bags, export activity is set to stay robust, particularly for producers that are regaining momentum after previous climate-related setbacks.
However, the market could face headwinds later in the year and into the next cycle. A projected global surplus of 7–10 million bags in the 2026–2027 crop year is likely to put downward pressure on global coffee prices, especially as Brazil, still the world’s largest exporter, ramps up its main harvest mid-2026.
Here are some forecasted dynamics shaping the coffee export market in 2026:
- Robusta gains, Arabica tightens: Robusta production is forecast to rise, especially in Vietnam and Brazil. Meanwhile, Arabica yields may drop due to drought in Brazil, tightening its supply.
- Price bifurcation likely: This divergence may create distinct price trends for Robusta and Arabica grades across international markets.
- Inventory volatility: Low levels of commercialization and persistent market fluctuations could result in unpredictable price swings early in the crop year.
- Quality push: For sustained competitiveness, exporters, especially Vietnam, are under pressure to improve bean quality and invest in deep processing to meet tightening international quality and traceability requirements.
Despite upcoming price pressures, 2026 remains a high-volume, opportunity-rich year for exporters who can maintain quality, diversify buyers, and adapt to evolving market demands.
For comparison with other commodity markets, see our Indonesia Coconut Oil HS1513 Export Data 2025 October Overview. The report shows a highly concentrated market where China controls 22% of export value, creating clear pricing and supply risks.
Premium-grade demand, strong volume from Brazil and the U.S., and high re-export activity through Singapore and the Netherlands highlight how quickly market dynamics can shift.
Conclusion
The 2025 coffee trade shows a market defined by strong demand, shifting power, and rising pressure to adapt. Colombia and Vietnam stand out among the top exporters of coffee, driven by high shipment volumes, price strength, and resilient supply chains. At the same time, climate shocks, tariffs, and new traceability rules are reshaping who can stay competitive.
The takeaway is clear: exporters who invest in compliance, understand real buyer demand, and follow data will lead the next phase of global coffee trade. And with tools like yTrade, navigating that future becomes far more strategic.
Frequently Asked Questions
Q1: Which is the biggest exporter of coffee in the world?
Brazil is the largest exporter of coffee in the world, especially for high-quality Arabica beans. Vietnam follows as the second-largest exporter, driven by its strong Robusta production, while Colombia ranks third with premium Arabica output. Other major exporters include Indonesia, Ethiopia, Uganda, and India.
Q2: What is the top 5 coffee in the world?
Some of the most celebrated coffees globally include:
- Jamaica Blue Mountain Coffee
- Sumatran Coffee
- Rwandan Coffee
- Kona Coffee (Hawaii)
- Tanzanian Coffee
You will also often see Geisha, Peruvian, and Ethiopian Yirgacheffe listed among the world’s best.
Q3: Which country is No.1 in coffee?
Brazil holds the No.1 position as the world’s largest coffee producer, a title it has maintained for over 150 years. The country produces over 2.6 million metric tons of coffee annually, supported by ideal growing conditions and vast production regions such as Minas Gerais and São Paulo.
Q4: Who are the top three exporters of coffee in 2025?
The top three exporters in 2025 are Vietnam, Colombia, and Brazil, leading global shipments and export value. Together, they represent more than 40% of global coffee trade volume, data analyzed by yTrade.
Q5 What drives Vietnam’s coffee export growth?
Vietnam’s growth is driven by record Robusta prices, increasing demand for instant and RTD coffee, and early-cycle purchasing due to concerns over tightening supply. Vietnam exported 159,324 shipments in 2025, the highest globally.
Q6: What is the difference between Arabica and Robusta in export trends?
The difference between Arabica and Robusta in export trends Arabica is tied to premium markets and is heavily impacted by drought-related supply pressures, mostly from Brazil. Robusta, driven by Vietnam and Indonesia, is seeing growth due to demand for lower-cost blends, instant coffee, and price-sensitive markets.
Q7: Which markets import the most coffee?
The largest importers of coffee include Europe, the United States, and rapidly growing Asian markets. Europe accounts for over one-third of global coffee imports, driven by strong consumption and expanding specialty coffee culture.
Top 5 Import Products Of The Philippines : A Deep Dive Into Each Category
The top 5 import products of the Philippines with values, trends, and market insights to guide your decisions. Read the full article for the complete breakdown.
2023 Apr Uzbekistan Global Trade Data Summary: Surge & Deficit
Uzbekistan's import and export data reveals a 53.5% YoY export surge to $1.6B, widening the deficit to $1.09B in Apr 2023, with gems/metals leading exports. Insights from yTrade.