
How Much Steel Does The US Import From The World? (2025 Data)
Introduction
In 2025, the question “How much steel does the US import?” reveals a market shaped by high demand, shifting trade lanes, and growing dependency on key partners.
Between January and July alone, the United States imported 18.1 billion kg of steel, with semi-finished non-alloy steel (HS 7207) and coated flat-rolled steel (HS 7210) among the largest product categories driving inflows. The U.S. also remains heavily tied to major suppliers such as Canada, Brazil, and Mexico, together contributing over US$17.8 billion in steel shipments.
To help businesses make sense of these evolving flows, yTrade provides real-time visibility into global steel movements, letting you track import volumes, supplier shifts, and category-level changes as they happen. Read the article for more!
How much steel does the US import in 2025?
In the first seven months of 2025, according to yTrade global trade data platform, the United States imported 18.1 billion kg of steel across major categories ranging from flat-rolled products to ferro-alloys. The data shows strong demand for coated flat-rolled steel, semi-finished products, and alloy steel used across construction, automotive, and manufacturing sectors.
Top U.S. steel import categories in 2025 (by Quantity):
- HS 7207 – Semi-finished non-alloy steel (2,415,089,581 kg): A core input for U.S. steel mills, widely used to produce plates, sheets, and structural steel.
- HS 7210 – Flat-rolled non-alloy steel, clad/plated/coated (2,292,601,379 kg): High-volume coated steel used heavily in automotive body panels, appliances, and construction.
- HS 7224 – Alloy steel ingots & semi-finished products (1,386,797,369 kg): Essential for producing high-strength components in machinery and energy equipment.
- HS 7208 – Hot-rolled flat-rolled steel, width ≥600mm (1,297,434,295 kg): Commonly used for structural applications, shipbuilding, and heavy manufacturing.
- HS 7209 – Cold-rolled flat-rolled steel, width ≥600mm (665,109,963 kg): Preferred for precision applications requiring smooth surfaces—automotive, electronics, and appliances.
- HS 7216 – Angles, shapes, and sections (589,607,697 kg): Widely used in construction frameworks, infrastructure, and fabrication.
- HS 7225 – Alloy steel flat-rolled, width ≥600mm (743,160,202 kg): Supports industries that require corrosion-resistant and high-strength steel sheets.
- HS 7202 – Ferro-alloys (807,816,607 kg): Crucial additives for steelmaking, enabling the production of specialty steels.
- HS 7213 – Hot-rolled bars and rods in coils (719,720,960 kg): Used in wire drawing, fasteners, and construction reinforcements.
- HS 7214 – Bars and rods, hot-rolled or forged (691,843,810 kg): Common in machine parts, tools, and engineering applications.
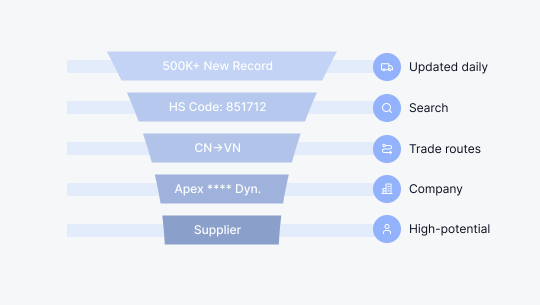
To help businesses understand these shifting flows, yTrade's Trade Activity Intelligence features instant visibility into real-world steel movements, covering nearly 70% of global trade flows.
Users can track U.S. steel imports by HS code, country, or counterparty, identify which product lines are accelerating or slowing, and detect structural changes, such as rising coated-sheet volumes or declining hot-rolled imports, before competitors notice.
- Track by HS code or trade lane to see which steel categories dominate U.S. demand.
- Spot volume shifts early using live shipment trends to anticipate sourcing changes.
- Identify new suppliers or risk signals based on counterparty behavior and market momentum.
With yTrade, manufacturers, distributors, and importers get the context they need to navigate supply volatility, strengthen sourcing strategies, and move in sync with market demand, confidently and ahead of the curve. Explore us now!

Where does the US get most of its steel?
The United States gets most of its steel from Canada, Brazil, and Mexico, with total trade value of US$17.8 billion, provided by yTrade data. These three countries dominate the U.S. steel imports thanks to established trade corridors, geographic proximity, and strong manufacturing linkages.
Who is the biggest importer of steel to the USA?
Below are the top countries of U.S. steel import by value and quantity.
- Canada — $3,602,977,821 | 2,477,904,483 kg: The largest steel supplier to the U.S., benefiting from USMCA integration and seamless cross-border manufacturing supply chains.
- Brazil — $2,754,884,854 | 2,554,344,289 kg: A key source of semi-finished steel, supporting U.S. mills and construction industries with high-volume shipments.
- Mexico — $1,714,248,920 | 1,675,576,874 kg: Strong automotive and industrial linkages make Mexico a consistent top-three exporter of steel to the U.S.
- South Korea — $1,020,118,417 | 882,218,983 kg: A major supplier of flat-rolled and high-grade steel used in automotive, electronics, and heavy industry.
- Germany — $994,022,684 | 545,723,267 kg: Known for supplying specialized and high-precision steel products for manufacturing and engineering needs.
- Taiwan, China — $736,925,936 | 487,430,277 kg: Strong in cold-rolled and coated steel, Taiwan supports U.S. electronics, machinery, and fabrication sectors.
- Japan — $678,381,378 | 441,500,026 kg: A long-standing supplier of premium steel grades used in automotive production and industrial machinery.
| Rank | Country | Value (US$) | Share (%) | Quantity (kg) |
|---|---|---|---|---|
| 1 | Canada | 3,602,977,821 | 20.24% | 2,477,904,483 |
| 2 | Brazil | 2,754,884,854 | 15.47% | 2,554,344,289 |
| 3 | Mexico | 1,714,248,920 | 9.63% | 1,675,576,874 |
| 4 | South Korea | 1,020,118,417 | 5.73% | 882,218,983 |
| 5 | Germany | 994,022,684 | 5.58% | 545,723,267 |
| 6 | Taiwan | 736,925,936 | 4.14% | 487,430,277 |
| 7 | Japan | 678,381,378 | 3.81% | 441,500,026 |
| 8 | Access yTrade to reveal data | 310,678,760 | 1.75% | Access yTrade to reveal data |
| 9 | Access yTrade to reveal data | 538,010,166 | 3.02% | Access yTrade to reveal data |
| 10 | Access yTrade to reveal data | 449,877,680 | 2.53% | Access yTrade to reveal data |
| U.S. Top Steel Import Countries (Jan-Jul 2025) | ||||
| Data Source: yTrade |
How much steel does the US import from Canada?
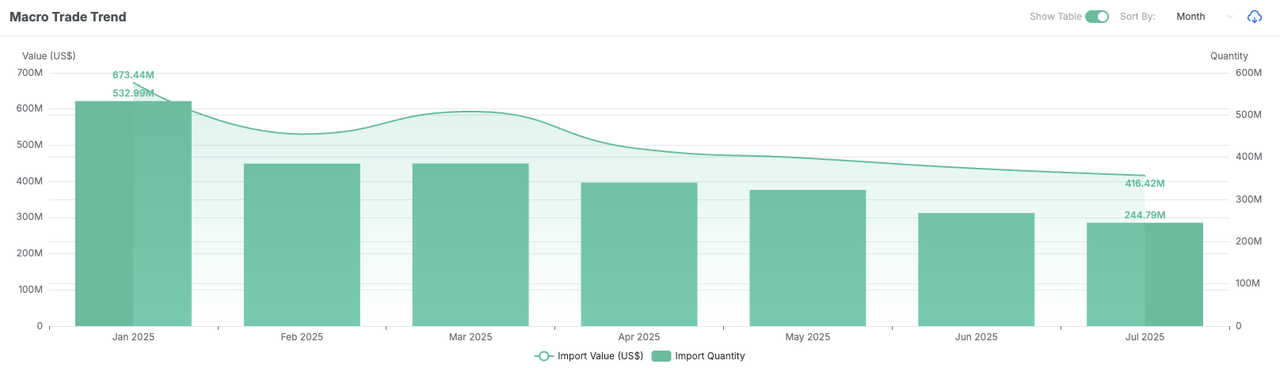
The United States imported 2.48 billion kg of steel from Canada, worth US$3.6 billion within the first seven months of 2025, analyzed by yTrade. Monthly import volumes consistently trended downward, falling from 533 million kg in January to 245 million kg in July, showing a sharp year-on-year decline throughout the period.
Despite this drop, Canada remains the largest steel supplier to the U.S. in 2025.
The United States imported 2.48 billion kg of steel from Canada, worth US$3.6 billion, within the first seven months of 2025, analyzed by the global trade data intelligence yTrade. Import volumes showed a consistent downward trajectory, declining from 533 million kg in January to 245 million kg in July, reflecting ongoing year-on-year contractions across the period. This indicates tightening trade conditions, weakened demand, or cost-driven sourcing adjustments.
Trend Summary (Jan–Jul 2025)
Canada’s steel exports to the U.S. were highest in January, but fell sharply by 28% in February. Shipments changed steadily through March and April, until dropped again in June and July, declining from 322M kg in May to 244M kg in July, a 24% decrease in just two months.
Even with this drop, Canada is still the U.S.’s largest steel supplier in 2025.
| Month (2025) | Value (US$) | YoY Change | MoM Change | Quantity (kg) | YoY Change | MoM Change |
|---|---|---|---|---|---|---|
| January | 673.44M | -11.00% | 0.2464 | 532.99M | -34.74% | -20.20% |
| February | 530.63M | -20.33% | -21.21% | 384.84M | -44.69% | -27.80% |
| March | 592.91M | -17.73% | 0.1174 | 385.09M | -49.95% | 0.0007 |
| April | 490.15M | -29.98% | -17.33% | 339.92M | -53.86% | -11.73% |
| May | 463.86M | -32.91% | -5.36% | 322.54M | -56.19% | -5.12% |
| June | 435.56M | -33.09% | -6.10% | 267.73M | -62.65% | -16.99% |
| July | 416.42M | -33.05% | -4.40% | 244.79M | -66.38% | -8.57% |
| U.S.-Canada Steel Import Trend (Jan-Jul 2025) | ||||||
| Data Source: yTrade | ||||||
 |
If you’re analyzing global steel flows beyond the U.S., Indonesia’s position in the Iron & Steel market (HS 72) offers important context.
In 2025, Indonesia exported an estimated $25.8 billion in steel, driven by rising stainless-steel output, stronger demand from China, and policy shifts that reshaped regional supply chains. Monthly volumes peaked in mid-year as Asian industrial activity accelerated.
Read the full yTrade breakdown in Indonesia Iron & Steel Export analysis.
The U.S. steel import market from Canada in 2025 is defined by sharp structural pressure driven by multiple tariff escalations.
What was once a predictable, integrated cross-border flow has shifted into a cost-sensitive, compliance-heavy trade environment.
For U.S. buyers, the year brings rapidly rising landed costs and shrinking pricing visibility:
- Tariff increases from 25% to 50% elevate the cost of Canadian steel inputs across automotive, construction, machinery, and manufacturing sectors.
- Forecasting becomes difficult, as mid-year tariff changes disrupt long-term procurement budgets.
- Supply instability emerges, with Canadian sellers slowing, adjusting, or renegotiating contracts as downstream steel products are caught under the newly expanded tariff list.
- Procurement diversification accelerates, as buyers reevaluate supplier portfolios to reduce exposure to tariff volatility.
For Canadian exporters, every shipment now requires deeper scrutiny of tariff exposure, HS classifications, and CUSMA strategy. The relationship continues to operate, but under far higher uncertainty and administrative load:
- 407 new derivative HTSUS codes added in August significantly expand the universe of steel-related goods exposed to the 50% tariff, including downstream and processed products.
- HS classification accuracy becomes high-stakes, as a minor coding difference can alter duty liability dramatically.
- CUSMA decision-making becomes complex, with exporters needing to determine whether claiming CUSMA or opting out results in lower overall tariffs under the new stacking rules.
- Contract disruptions increase, including cancellation, renegotiation, and delayed orders, reflecting uncertainty from U.S. buyers.
- Cash-flow pressure rises, pushing firms to rely on financing, insurance, or cost-optimization programs to manage rapid duty changes.
- Market diversification becomes urgent, with companies exploring non-U.S. markets due to tighter margins and reduced predictability.
Overall, the U.S.–Canada steel trade in 2025 remains active but operates under clear downward pressure. The issue is not declining demand but rather the escalated cost, compliance complexity, and shipment-by-shipment tariff evaluation required for cross-border steel movement. The market continues to function, yet every transaction now requires more strategic planning, more documentation precision, and more risk management than ever before.
How much steel does the US import from China?
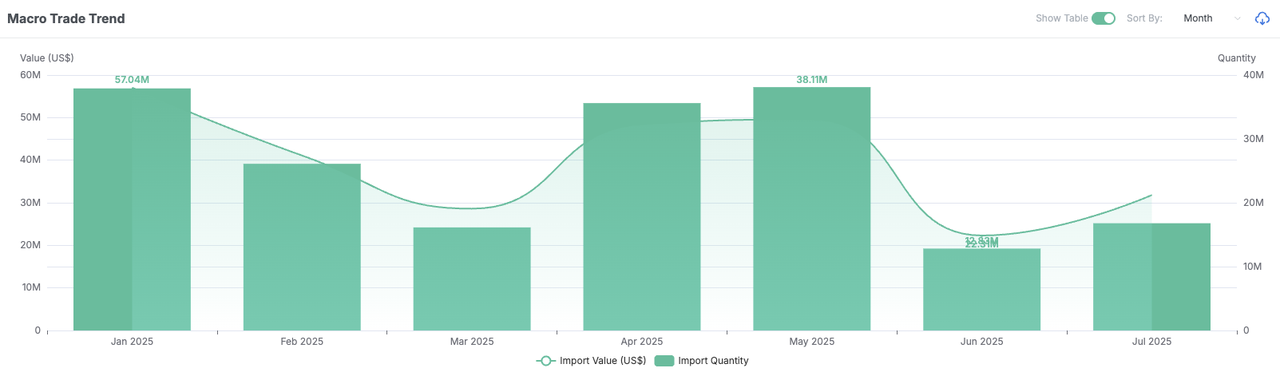
The United States imported 183.48 million kg of steel from China between January and July 2025, data provided by yTrade. This total reflects fluctuating monthly volumes, with stronger inflows early in the year and sharper declines in June and July, but overall adds up to 183.48 million kg of Chinese steel entering the U.S. market during this seven-month period.
Trend Summary (Jan–Jul 2025)
Steel imports from China were highest in January (37.91M kg) but fell by 31% in February and dropped again by 38% in March. Imports recovered briefly in April and May, reaching 38.11M kg, before declining sharply in June (−57%) and remaining low in July. This shows a short mid-year rebound followed by a steep pullback as 2025 progressed.
Overall, the pattern shows a mid-year peak followed by a clear slowdown in China-to-U.S. steel shipments.
| Month (2025) | Value (US$) | YoY Change | MoM Change | Quantity (kg) | YoY Change | MoM Change |
|---|---|---|---|---|---|---|
| January | 57.04M | 0.4264 | 0.1031 | 37.91M | 0.7958 | -3.58% |
| February | 41.10M | 0.005 | -27.94% | 26.10M | 0.1849 | -31.14% |
| March | 28.62M | -10.83% | -30.38% | 16.14M | -9.83% | -38.16% |
| April | 48.43M | 0.1547 | 0.6923 | 35.61M | 0.5267 | 1.2059 |
| May | 49.55M | 0.1966 | 0.0231 | 38.11M | 0.4165 | 0.0702 |
| June | 22.31M | -56.23% | -54.97% | 12.83M | -57.47% | -66.34% |
| July | 31.82M | -65.65% | 0.4265 | 16.79M | -73.37% | 0.3093 |
| U.S.—China Steel Import Trend (Jan–Jul 2025) | ||||||
| Data Source: yTrade | ||||||
 |
As companies source from China, understanding compliance markings becomes just as important as tracking volumes. One common misconception is the similarity between the China Export mark and the CE mark, a confusion that can affect risk assessments, product acceptance, and cross-border approvals.
Gain more insights from our detailed comparison & easy explanation: China Export vs CE Mark.
Steel imports from China in 2025 show a brief rebound followed by renewed pressure, reflecting a fragile trade environment shaped by short-term policy easing and rapid tariff escalation.
Imports recovered noticeably in April and May.
In May alone, the U.S. imported 49,913 tonnes of finished Chinese steel, up 22.7% year-on-year and 14.5% higher month-on-month.
According to market watchers, this improvement coincided with a 90-day tariff-easing window between the U.S. and China beginning May 14. Although steel wasn’t directly included, the reduction in broader reciprocal tariffs boosted sentiment, prompting traders and buyers to resume ordering.
But this momentum was short-lived.
In early June, the U.S. abruptly doubled Section 232 steel and aluminum tariffs from 25% to 50%, pushing the effective tariff burden on Chinese steel to as high as 95%. Industry analysts expect this to severely restrict Chinese steel inflows in the following months as American buyers reassess sourcing decisions under the tightened regime.
Several structural factors reinforce this trend:
- China already supplies very little steel directly to the U.S., accounting for less than 2% of U.S. steel imports due to multi-year tariffs in place since 2018.
- Most Chinese steel reaching the U.S. is indirect, routed through third countries or reclassified products—flows expected to face greater scrutiny and cost pressure under the new tariff structure.
- Domestic and allied-country suppliers (Canada, Mexico, Japan, South Korea, Germany) remain more competitive due to closer trade ties and lower tariff exposure.
How much steel does the US import from Turkey?
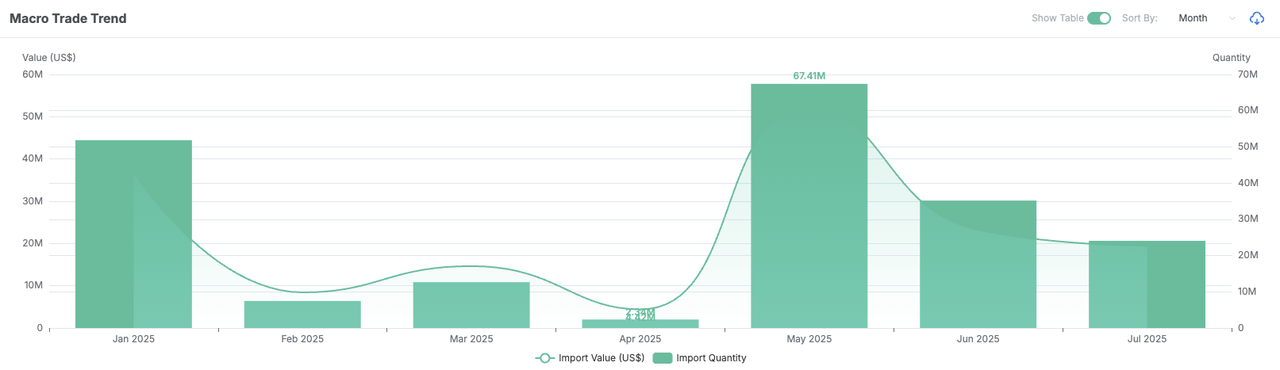
From January to July 2025, yTrade's data highlighted that the United States imported 200.97 million kg of steel from Turkey, worth over US159 million. This total reflects highly volatile monthly shipments, with sharp swings in both value and quantity, but overall adds up to 200.97 million kilograms of Turkish steel entering the U.S. market during the first seven months of the year.
Trend Summary (Jan–Jul 2025)
Steel imports from Turkey were strong in January, but fell sharply by 85% in February and another 69% in April. The market then surged in May, rising over 1,070% month-over-month to reach the highest level of the year. After this spike, imports declined again by 55% in June and a further 16% in July, highlighting highly unstable shipment patterns across the period.
In total, the United States imported 200.97 million kg of steel from Turkey from January to July 2025, demonstrating a volatile but meaningful flow of Turkish steel into the U.S. market.
| Month (2025) | Value (US$) | YoY Change | MoM Change | Quantity (kg) | YoY Change | MoM Change |
|---|---|---|---|---|---|---|
| January | 36.97M | 0.7487 | 2.7721 | 51.84M | 2.0383 | 4.8324 |
| February | 8.43M | -14.39% | -77.72% | 7.46M | -44.32% | -85.60% |
| March | 14.64M | -70.06% | 0.7371 | 12.65M | -78.88% | 0.6953 |
| April | 4.42M | -71.26% | -69.85% | 2.34M | -85.05% | -81.50% |
| May | 51.97M | 0.9727 | 10.7698 | 67.41M | 0.9714 | 27.8044 |
| June | 23.20M | 3.4248 | -55.36% | 35.19M | 6.2784 | -47.87% |
| July | 19.46M | -6.96% | -16.12% | 24.07M | 0.2008 | -31.59% |
| U.S.—Turkey Steel Import Trend (Jan–Jul 2025) | ||||||
| Data Source: yTrade | ||||||
 |
If you’re responsible for sourcing, supply chain strategy, or competitive intelligence, your real concern is simple: Are your buyers or competitors shifting without you seeing it?
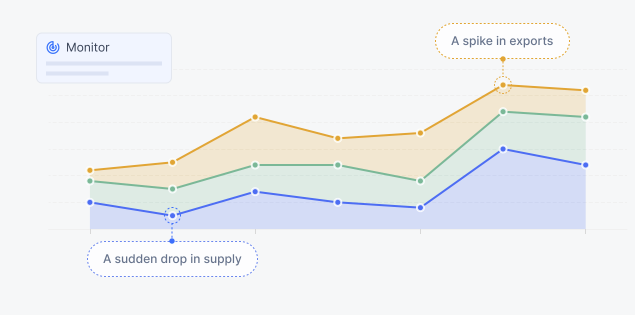
Those early movements, new suppliers, sudden volume drops, quiet port changes, are exactly what disrupt margins before anyone realizes what happened.
That’s where yTrade’s Market & Competitor Monitoring becomes invaluable for you:
- Spot sourcing changes early: Instantly see when U.S. buyers reduce Turkish steel orders or test new suppliers elsewhere.
- Track competitor moves: Identify which mills or traders your competitors start buying from, and how their volumes shift week by week.
- See new trade lanes forming: Catch emerging ports and routing changes before they reshape the market you operate in.
If you want to stay ahead rather than react after the fact, book a personalized yTrade demo.
We’ll show you exactly how your team can track real sourcing changes in real time and act with confidence before the market moves.
U.S. steel imports from Turkey in 2025 show a volatile but opportunity-sensitive performance, driven by shifts in anti-dumping rulings, tariff realignments, and Turkey’s evolving competitive position in the North American steel market.
Overall imports reached 200.97 million kg from January to July, but the monthly pattern is unstable—sharp surges (e.g., May’s explosive rebound) followed by steep declines illustrate a market still reacting to overlapping policy actions.
The United States Commerce Department issued affirmative anti-dumping and countervailing duty determinations against Turkish corrosion-resistant steel in early 2025. This increased compliance scrutiny and duty exposure for Turkish mills, particularly in coated steel used in automotive, appliances, and construction.
At the same time, the March 12 announcement reset all steel tariffs to a uniform 25%, eliminating long-held exemptions for Canada, Mexico, Brazil, and others. For Turkey, already operating under a 25% tariff since 2019, this leveled the playing field.
Turkish producers see two contrasting forces shaping performance:
Positive drivers
- Turkey gains relative competitiveness as previously exempt countries now face the same 25% tariff rate.
- Producers expect higher demand for cold-rolled and galvanized coil, where Turkey already has a strong foothold in North America.
- May’s massive MoM spike in U.S. import volume (+2780.44%) reflects buyers briefly capitalizing on competitive Turkish supply before new trade actions took effect.
Negative pressures
- Anti-dumping investigations add additional cost layers on top of the 25% tariff, squeezing margins for Turkish exporters.
- Market participants warn that countries losing access to the U.S, including South Korea, Japan, and some ASEAN suppliers, may divert their steel toward Turkey, increasing competitive pressure in Turkey’s home and regional markets.
- Import declines in June and July indicate buyer hesitation as the U.S. clarifies new tariff frameworks and expands coverage to derivative products.
Turkey’s strong position in cold-rolled and galvanized steel provides a strategic advantage, but exporters must navigate tighter trade remedies, a more crowded global market, and U.S. buyers who are increasingly cautious under the evolving tariff landscape.
How much steel does the US import from the UK?
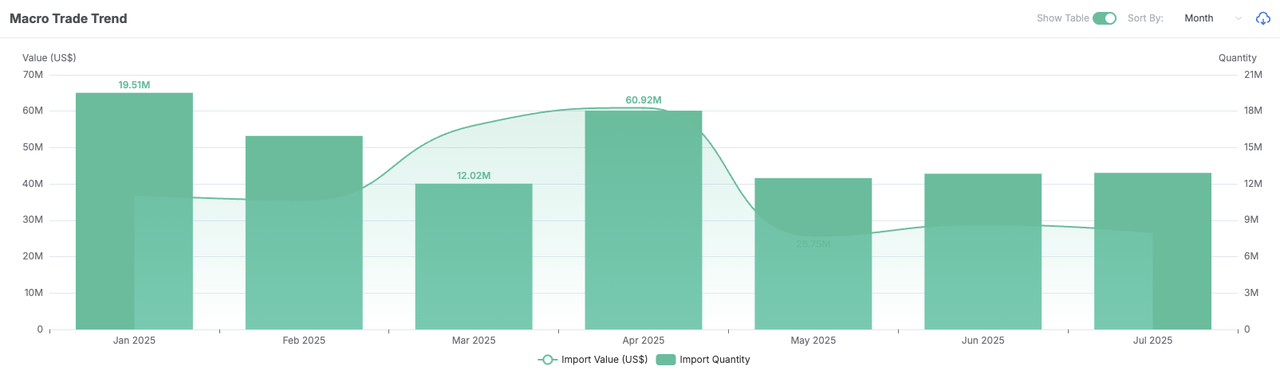
The United States imported 103.78 million kg of steel from the United Kingdom between January and July 2025, according to yTrade. This total reflects fluctuating monthly shipments, strong inflows in January and April, followed by softer volumes in May through July, but overall adds up to 103.78 million kilograms of U.K.-origin steel entering the U.S. market during the seven-month period.
Trend Summary (Jan–Jul 2025)
Steel imports from the U.K. were strong in January, then declined by 66% month-over-month in February. After a recovery in March and an 8% increase in April, shipments dropped sharply again in May by 57%, and remained relatively low through June and July, with minimal month-to-month change.
To conclude, U.S. steel import from the U.K shows early strength followed by sustained lower volumes in mid-year.
| Month (2025) | Value (US$) | YoY Change | MoM Change | Quantity (kg) | YoY Change | MoM Change |
|---|---|---|---|---|---|---|
| January | 37.07M | 0.5156 | -30.83% | 19.51M | 0.9574 | -66.32% |
| February | 35.56M | -12.47% | -4.07% | 15.96M | -14.55% | -18.21% |
| March | 56.05M | 0.4603 | 0.5764 | 12.02M | -35.15% | -24.67% |
| April | 60.92M | 0.2573 | 0.0868 | 18.04M | -22.83% | 0.5005 |
| May | 25.75M | -42.99% | -57.74% | 12.48M | -42.73% | -30.80% |
| June | 28.85M | -10.99% | 0.1204 | 12.84M | -6.38% | 0.0286 |
| July | 26.69M | -37.64% | -7.48% | 12.91M | -41.67% | 0.0055 |
| U.S.—U.K Steel Import Trend (Jan–Jul 2025) | ||||||
| Data Source: yTrade | ||||||
 |
U.S. steel imports from the United Kingdom in 2025 operate within one of the most uncertain and politically fluid environments among major U.S. trading partners. The U.K. typically ships around 200,000 tonnes of steel to the U.S. annually (worth over £400 million), but the 2025 trading climate is defined by unresolved tariff negotiations, quota ambiguity, and concerns around the “melted and poured” requirement that affects qualification for exemptions.
From January to July 2025, the U.S. imported 103.78 million kg of U.K. Steel, steady enough to maintain the U.K.’s position as an important but not dominant supplier, yet fragile due to policy shifts on both sides. Market volatility across the first seven months mirrors this reality, with strong inflows in early spring and clear contraction in May through July.
The broader market performance is shaped by two opposing forces:
Positive drivers of performance
- Relative tariff position improves as many other countries now face 50% tariffs, while the U.K. remains at 25%, giving U.K. mills a competitive advantage over higher-tariff suppliers.
- Specialised U.K. steel products retain high demand in the U.S., especially in defence, aerospace, stainless, and advanced engineering sectors where U.S. buyers rely on qualities not easily replicated elsewhere.
- Initial signs of tariff-relief negotiations (e.g., proposed reduction of the 25% levy to zero) provide hope, lifting buyer sentiment, even though the deal remains unfinalised.
Negative pressures restricting performance
- Uncertainty over whether new U.S. tariff actions override Section 232 exemptions and tariff-rate quotas, leaving U.K. exporters unable to predict duty exposure or quota limits.
- Risk that the 25% tariff may double to 50% if no agreement is reached by July 9—casting a shadow over medium-term planning.
- Persistent global overcapacity, meaning any U.S. tariff expansion can push displaced steel into the U.K. market, threatening its domestic industry and indirectly affecting export capacity.
- The “melted and poured” requirement disadvantages U.K. mills undergoing transitional production changes (e.g., Tata Steel importing semi-finished steel from India or the Netherlands).
- Product-level uncertainty on whether tariff relief, if agreed, would apply only to primary steel or also to derivative steel products.
Conclusion
In 2025, U.S. steel imports remain substantial, totaling 18.1 billion kg from January to July. Canada leads with 2.48 billion kg, followed by Turkey (200.97 million kg), China (183.48 million kg), and the U.K. (103.78 million kg). Key demand centers continue to be semi-finished non-alloy steel and coated flat-rolled products, reflecting the needs of U.S. manufacturing, automotive, and construction industries.
For teams overseeing sourcing, trade strategy, or competitive intelligence, the next step is strengthening visibility and decision-making. With yTrade’s AI-powered trade intelligence, you can analyze shipment patterns, compare supplier performance, and uncover market shifts with far greater clarity.
Book a personalized yTrade demo to see how AI in supply chains can advance your trade operations and help you plan with confidence.
Frequently Asked Questions
Q1: How much steel is imported to the USA?
- In the first seven months of 2025, the U.S. imported 18.1 billion kg of steel across major categories such as flat-rolled products, semi-finished steel, alloy steel, and ferro-alloys.
- Key import categories included semi-finished non-alloy steel (2.4B kg), flat-rolled coated steel (2.29B kg), and alloy semi-finished products (1.38B kg).
Q2: Where does the US get the most steel from?
- Canada remains the No.1 steel supplier to the U.S., historically taking ~20% of total U.S. steel imports.
- Other major partners include Mexico, Brazil, South Korea, Japan, and Germany, depending on product type.
Q3: Is the USA self-sufficient in steel?
- No. The U.S. relies heavily on imports to meet domestic demand.
- Roughly 20% of all steel used in the U.S. in 2023 was imported (Census Bureau data).
- Domestic production alone cannot supply total consumption, especially for specific flat-rolled and specialty products.
Q4: How much steel does the US import from Canada?
- The U.S. imported 2.48 billion kg of Canadian steel between January and July 2025.
- Canada remains the U.S.’s largest steel import partner by volume and strategic supply role.
Q5: How much steel does the US import from China?
- The U.S. imported 183.48 million kg of steel from China in the first seven months of 2025.
- Volumes fluctuated significantly, with higher inflows earlier in the year and sharp declines mid-year.
Q6: How much steel does the US import from Turkey?
- The U.S. imported 200.97 million kg of steel from Turkey from January to July 2025.
- Monthly shipments were highly volatile, reflecting geopolitical pressures and duty-related adjustments.
Q7: How much steel does the US import from the UK?
- The U.S. imported 103.78 million kg of steel from the United Kingdom across the same period in 2025.
- UK shipments remain modest compared to Canada and Mexico but strategic in defense and aerospace-grade steel.
Q8: Who is America’s largest steel producer?
- U.S. Steel operates at among the lowest domestic capacity (76%), but Nucor and Cleveland-Cliffs are the leading U.S. producers by output and market share.
- Domestic mills cannot fully meet demand, sustaining reliance on imports.
Q9: Who exports steel to the U.S.?
- Primary exporters include Canada, Mexico, Brazil, South Korea, China, and Turkey.
- Each contributes differently by product type, like semi-finished, coated, alloy, and cold-rolled categories.
2025 Vietnam Computers Export (HS 8471): Surge & Risk
Vietnam's Computers export (HS code 8471) surged 110% despite U.S. tariffs, driven by bulk shipments. Track trends on yTrade for insights into market reliance and tariff risks.
How To Find International Buyers For Export: A Complete Guide
Discover how to find international buyers for export using fairs, B2B platforms, Google search, social media, cold emails, and data-driven tools like yTrade.